
Is release planning done in scrum? Managing Stakeholder expectations & forecasting
Share
First of all, what is meant by release planning? (An old-fashioned term, but we’re still stuck with it).
What is “release planning”?

What people mean by “release planning” is trying to forecast when we will deliver certain things when certain releases might happen, and we might not know for sure what’s on those releases.
In Scrum, the product owner will decide when the releases are but might not know for sure what will be on those releases. In fact, because of so much uncertainty, the real answer is we don’t know. We don’t know what will be delivered, what functionality will be delivered, and we don’t know when we will solve particular problems.
We’re dealing with so much uncertainty. BUT we do make some efforts sometimes to figure out when certain things might be delivered, and the most useful way that I have found to do that is using Monte Carlo Probabilistic Forecasting.
Navigating uncertainty: What is Monte Carlo Probabilistic Forecasting?

When using probabilistic forecasting, one option is to essentially guesstimate as a team how small and big the backlog might be for a given goal/release.
I like to say, give me a 90% chance you’re right, 10% chance you’re wrong kind of guess. Give me a range. How small could the product backlog be? How big could the product backlog be?
You could also guesstimate how few items you deliver in a sprint and how many items you deliver in a sprint. I prefer to do it based on data — so if you actually have some data in terms of what was delivered in a sprint, that is really forecasting because if you don’t have data in terms of what you’re delivering, you are still just estimating.
Estimates are just estimates. They’re not commitments. Scrum has moved on. Check out my InfoQ article on Sizing & Forecasting in Scrum.
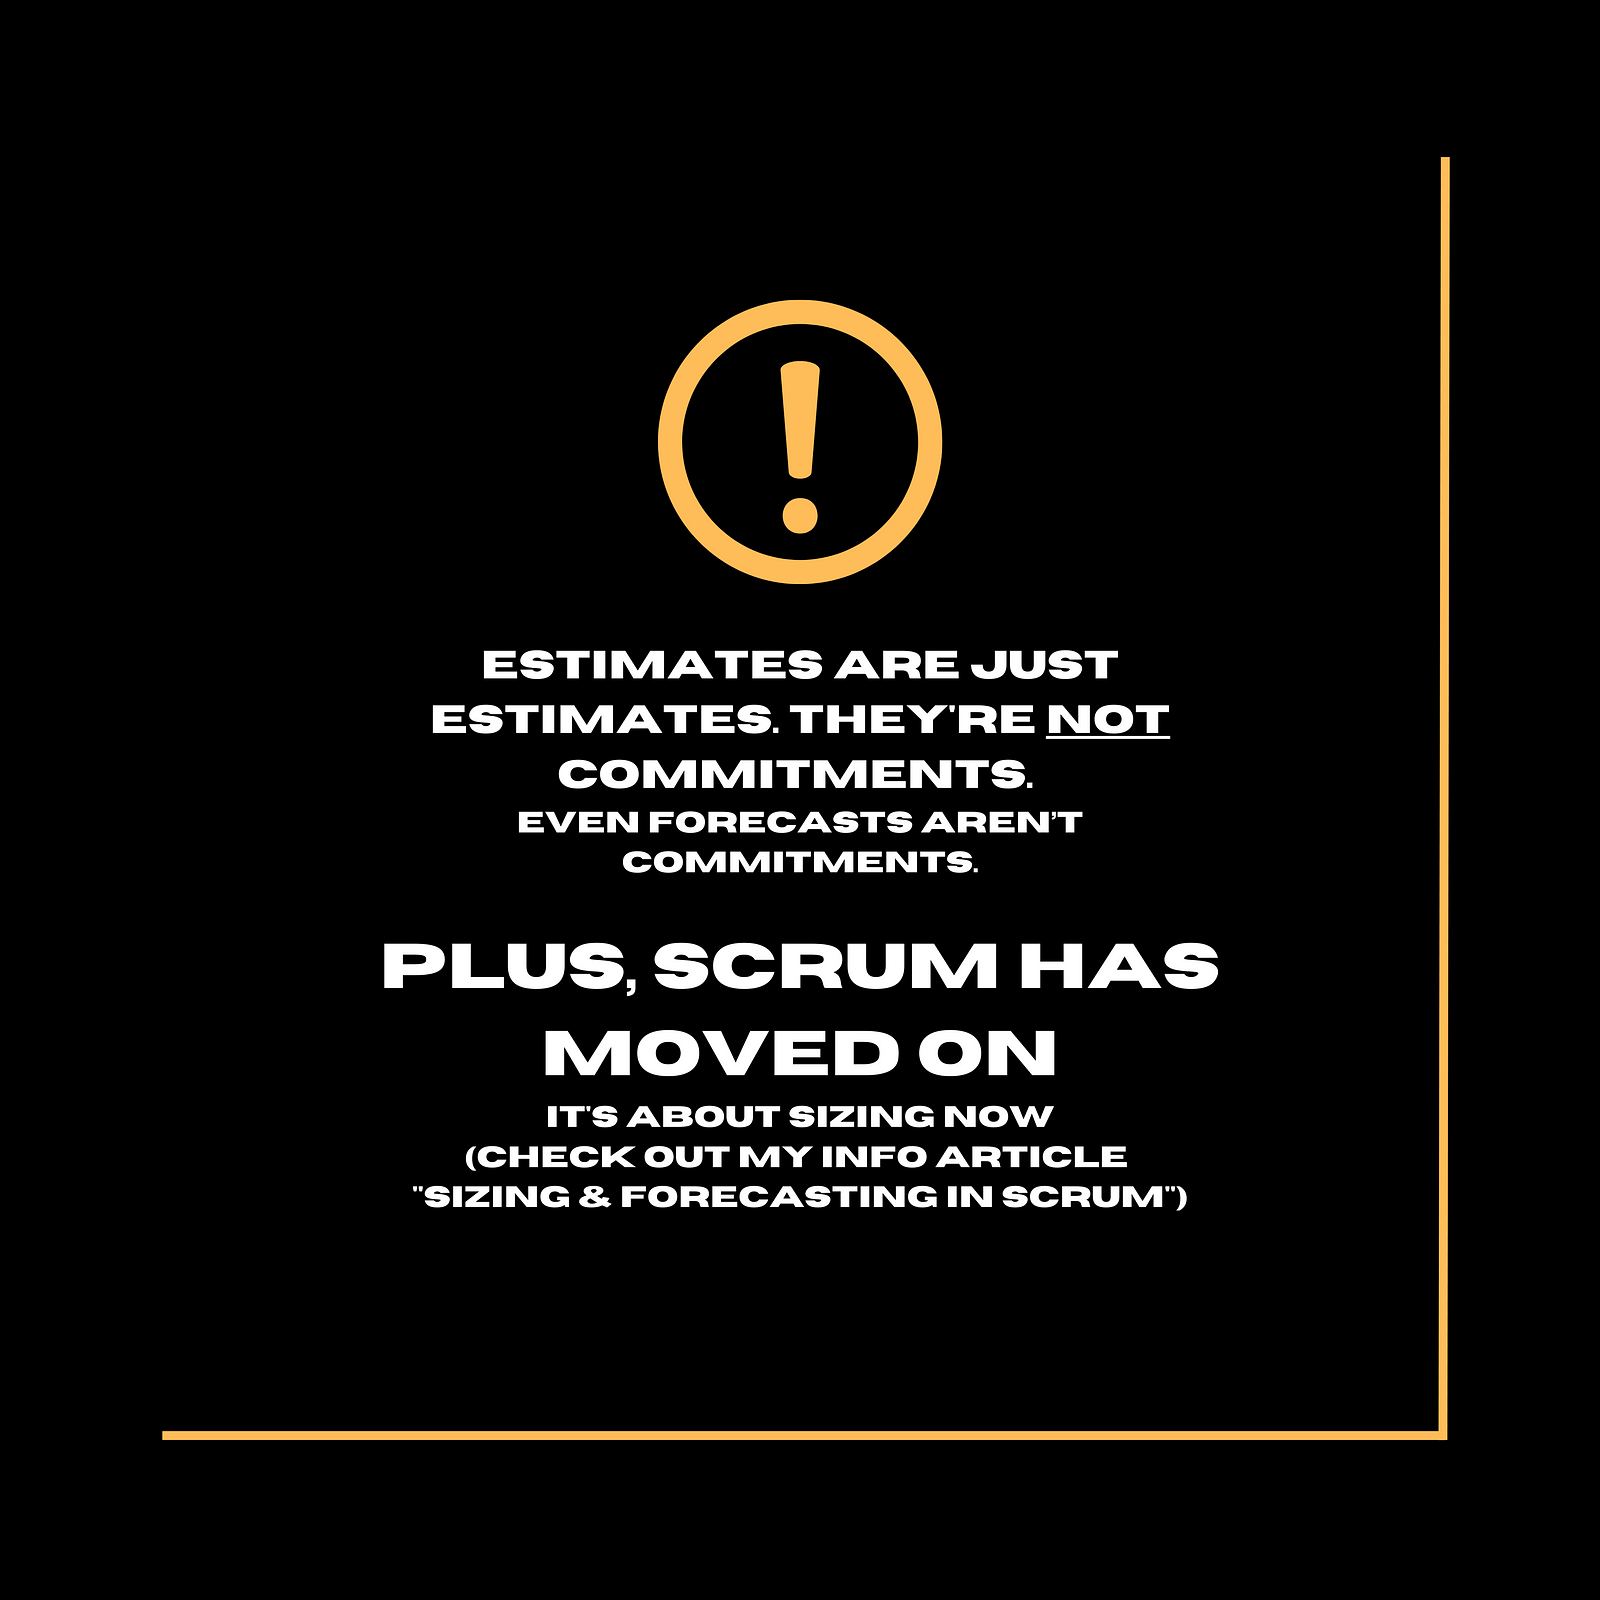
Even forecasts aren’t commitments. We are so used to getting weather forecasts that way, and we’re used to the uncertainty in the weather forecasts. We understand that it can be wrong; the same is true for product development.
Using Monte Carlo Probabilistic Forecasting & Throughput
You can use Monte Carlo Probabilistic Forecasting, you can use commercial tools, or you can use free tools. Random numbers are generated between how small the backlog might be and how big the backlog might get, and the min/max of throughput for the relevant period is (how many items you deliver in a sprint to how big the throughput gets per sprint).
Throughput = how many items you deliver in a (time period, e.g., a) sprint to how big the throughput gets
You might even look at the median of throughput as well as min/max in some tools. Great tools consider the work already in progress.
EXAMPLE:
Say maybe 10,000, maybe a million simulations are run. From that, you get a projection of different dates when it’s likely the work will be delivered by different dates.
Side note: avoid picking the middle because that’s like 50–50 heads or tails, a 50% chance of delivery based on the data. But ACTUALLY you’ll find it’s not 50–50 because we know we’ll have a different forecast next week; things will change.
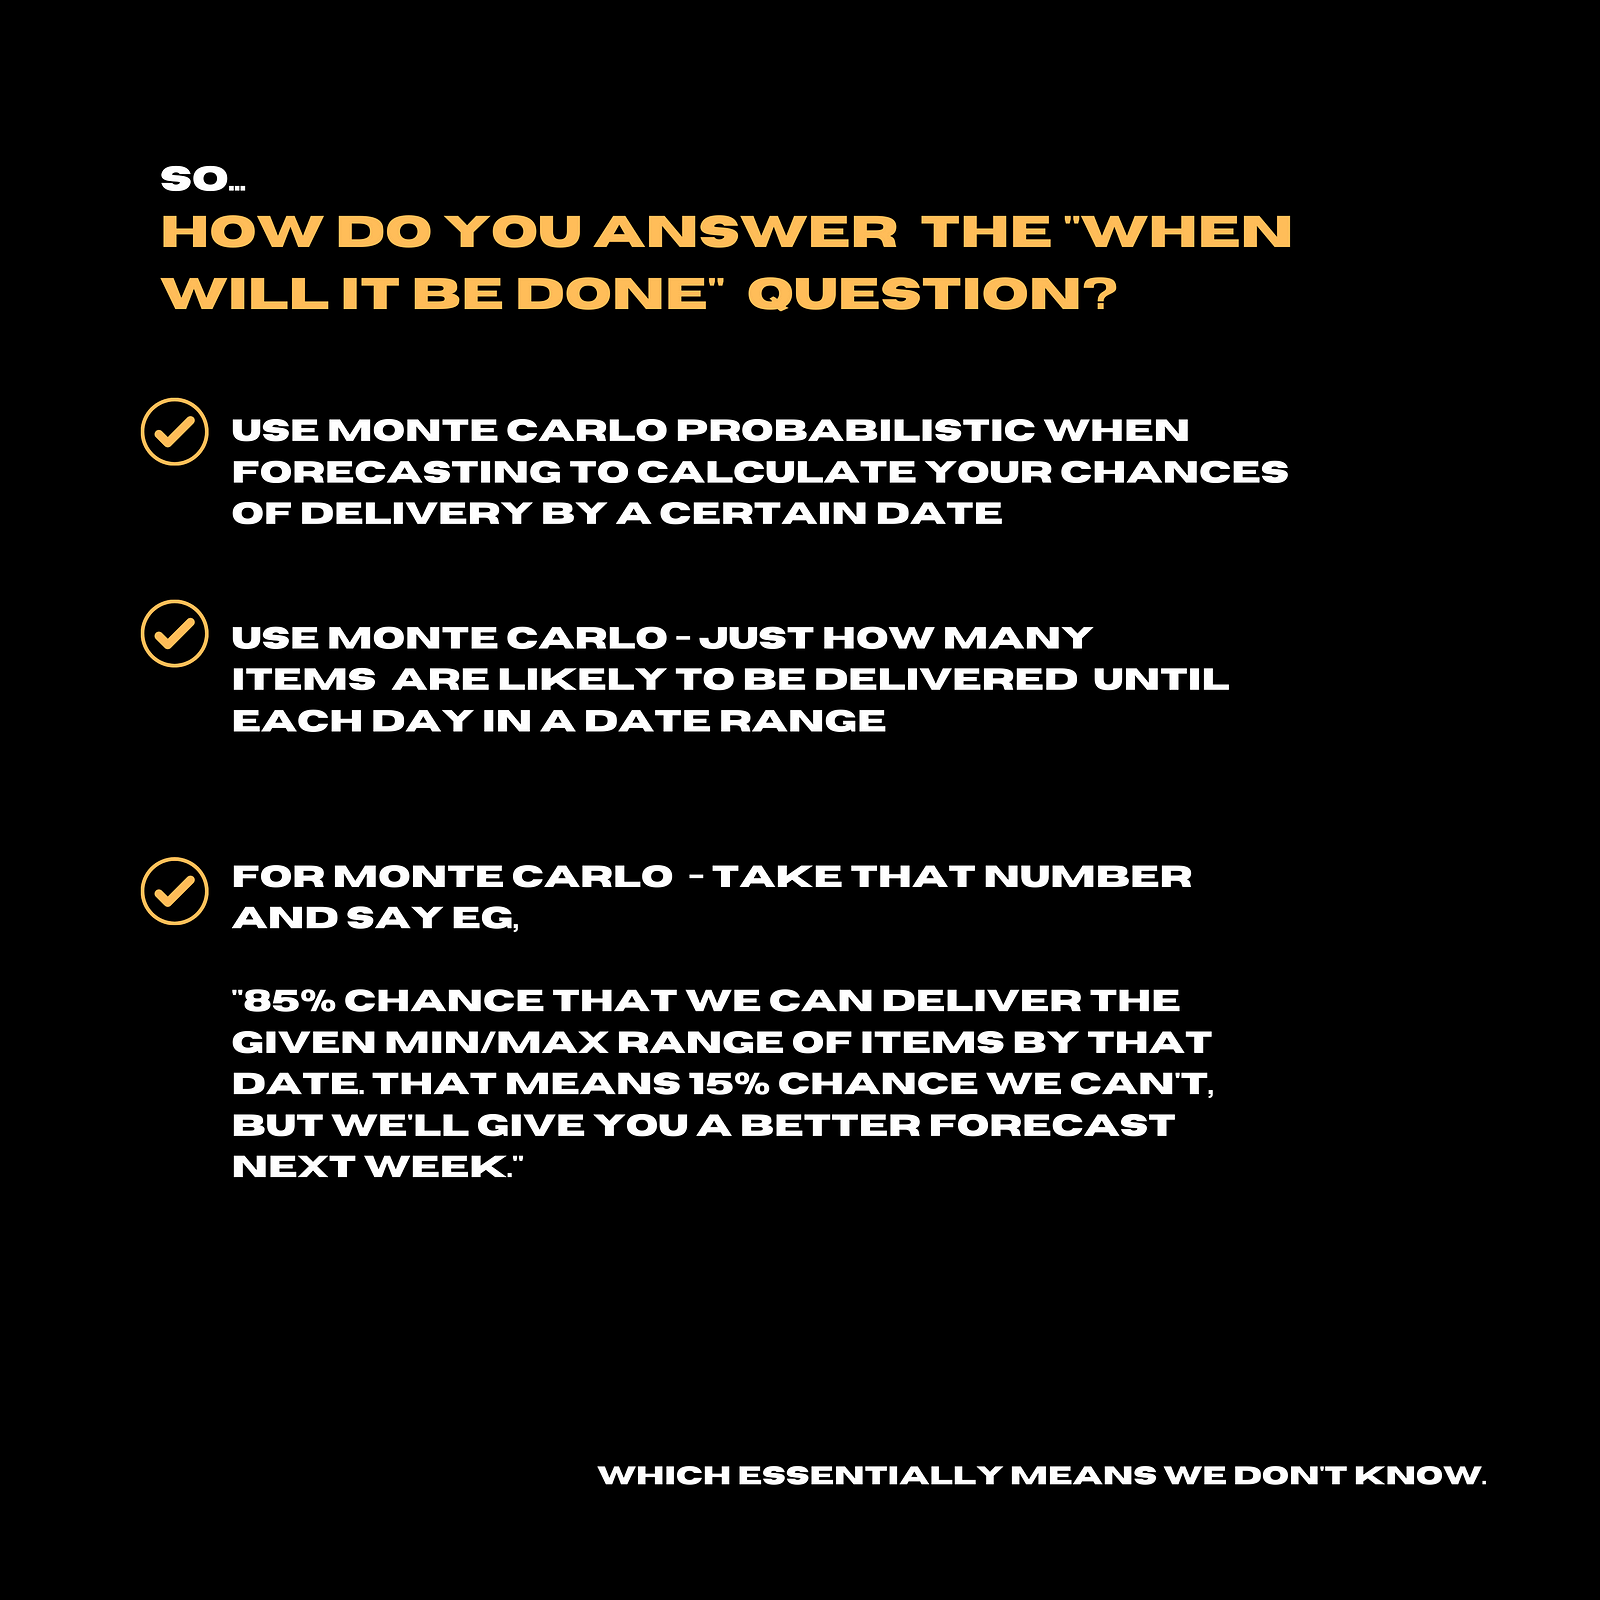
So I like to say if I don’t get 50–50, I go more to the right-hand side of the histogram forecast. Maybe 70%, 85%, let’s say the 85th percentile — I’d say 85% chance that we can deliver by that date.
That means a 15% chance we can’t, but I’ll give you a better forecast next week, which essentially means we don’t know. It’s just a nice way of calculating it.
You can also do this as well based on relative positions on the product backlog, but we also know that the backlog could change. At a sprint review, new ideas are usually much better than the old ideas, so it’s like a new set of clean plates on top of the old plates in a restaurant. Those old plates get pushed down, and so items lower down the backlog get pushed down. Consequently, the items on the backlog might get pushed further and further away.
But if people are concerned about particular items in the backlog, it might never happen. This is because those new ideas are usually better than the older ideas, and we do want to be chasing value.
The best thing we can get with a traditional approach is what we asked for. The best thing we can achieve with an agile approach is something much better because the sprint review is where the customer or end-user gets to see what she asks for but doesn’t want. We give them frequent opportunities to figure that out.
Where is the best place to look at the forecast?
The best place to collectively look at the forecast with stakehodlers would be the sprint review. That’s because the stakeholders, including the customers and the end-users, are at the sprint review.
You can also look at a few sprints ahead in sprint planning, BUT that’ll be private within the team because stakeholders aren’t invited to sprint planning. We might have some technical experts that are invited to give us some extra knowledge in sprint planning, but if you want stakeholders who are trying to understand what’s going on with the product AND they want to understand when things will be done, THEN those stakeholders would attend the sprint review and maybe some other ad hoc sessions.
BUT in Scrum, there’s an event called Sprint Review, and out of the four inspect and adapt events, the sprint review might be the best place to review what’s going on, where we’re going, whether it’s time to trim the tail due to diminishing returns, and move onto the next product goal.
Burn-up charts: are they in or are they out?
There is another option as well — quite an old-fashioned approach in Scrum. Burn-up charts allow us to look at how we’re doing, how much work we are burning, how many items we are finishing, and so on. Then you can draw a trend line. You can say, well, if that trend keeps going, and you could have a scope line across the top and where those lines meet, the trend of what we’re burning against the scope line at the top. Then you drop it down to the calendar date in the future, and you’ll see that we might deliver by this date.
But that’s 50–50 heads or tails. It’s not very good. And remember, we’ll have a better forecast next week. So it’s actually under 50–50, really.
Depending on how much noise you have in your throughput as the team, how many items the team is delivering will kind of dictate the gaps between the optimistic and the pessimistic lines of the burn-up chart.
Concluding Remarks
I find burn-up charts to be quite dangerous because people tend to see what they want to see. Optimistic people will see the optimistic line; pessimistic people see the pessimistic line. It’s difficult to get people aligned. We also call this the cone of uncertainty, where there’s a gap between the most optimistic date and the most pessimistic date for a given amount of scope if you like.
The word “scope” is alien to Scrum as well because we are trying to fix problems and avail of opportunities, not deliver outputs. We’re trying to deliver value. We’re trying to deliver value as quickly as possible to discover the value sooner.
So forecasting and release mapping can be done as part of scrum, which is a typical practice. I’m nervous about roadmaps other than Now, Next Later or Transformation Maps with elongating and more vague timelines. The Product Goal is in the direction of travel, and we discover through good empiricism if the goal is wrong. There is a human tendency to persevere instead of pivot or stop when the evidence is compelling. We should not persevere. Give Scrum its due; the Sprint Review is a great opportunity to pause and reflect if the Product Goal is still worth pursuing.
My preferred approach to forecasting is Monte Carlo Probabilistic Forecasting.
One health warning with Monte Carlo Probabilistic Forecasting is if the throughput of your team is irregular, if your team is maybe not delivering so often, or if the team has sprints where they don’t deliver anything, or the team is delivering everything on the last day of the sprint, for example, the quality of your Monte Carlo Probabilistic Forecast is going to be less because from a statistical point of view when it’s looking at your historical throughput, most days you deliver nothing.
So that will not be a great forecast, but if you have problems with your forecast with Monte Carlo because of irregular throughput, you’ve actually got bigger problems with forecasting; you got a plumbing problem. You need to fix the plumbing problem before you’re worried about your forecasting problem.
Never ever use flow metrics for sub-tasks. We’re maximizing potential value, not activities.
Thank you.